Introduction
This is part 5 in a series of fundamental aircraft design articles that aims to give you an introduction to aircraft design principles. In a previous post we looked at the importance of the shape and plan-form of the wing, and how this has a great impact on the flying characteristics of the aircraft. Specifically we looked at wing area and aspect ratio.
Now we'll move on and look more closely at the shape of the wing airfoil: why this differs from aircraft to aircraft, and how a careful airfoil selection will help to produce the flying characteristics you desire for your airplane.
After reading the post on wing area and aspect ratio, you should appreciate that there exists a very clear relationship between the size (weight) of the aircraft and the size of the wing (wing area) required to operate the aircraft as intended. We also discussed the aspect ratio and how a longer, thinner wing will reduce the total drag of the wing up to a particular speed; whereafter transonic speed effects begin to dominate the total drag produced which necessitating a sweeping of the wing to combat the transonic drag rise.
Airfoil Nomenclature
We are now going to move from looking at the wing in planform and concentrate on the section profile of the airfoil that is used on the wing. Before we do this we'll start by presenting a few fundamental definitions in order to understand how and why an airfoil is shaped as it is.
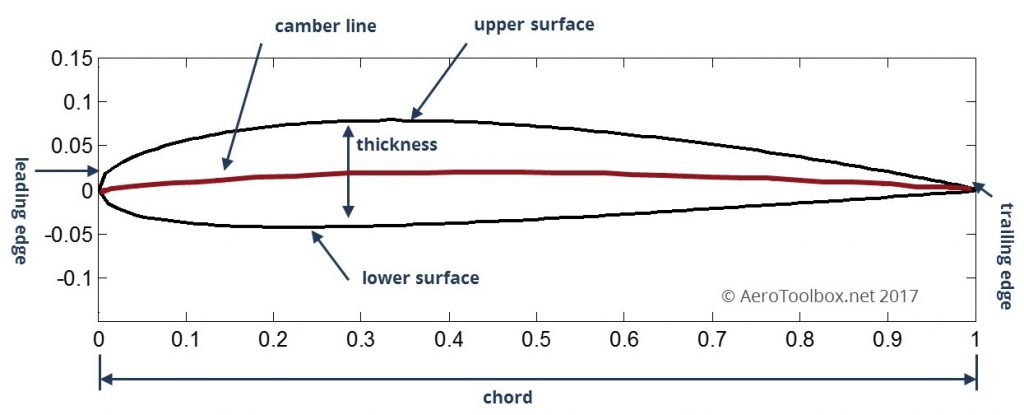
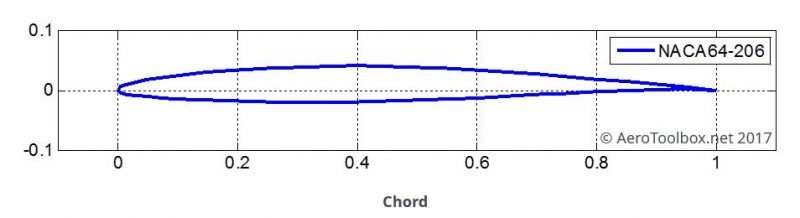
The front of the airfoil is named the leading edge and the rear the trailing edge. This is easy to remember if you think of the front of the airfoil as leading its movement through the air. The airfoil upper and lower surfaces meet at the leading and trailing edges.
The length of the airfoil from leading to trailing edge is known as the airfoil chord. This often varies down the span of the wing as the wing tapers from the root to the tip. In the example shown above, the chord has been normalized such that the leading edge is located at a chord location 0 and the trailing edge at 1. This is a convenient way to display an airfoil, as different chords can be normalized and compared directly to one another.
The thickness of the airfoil is a very important design parameter and as always expressed as a percentage of the total chord. The airfoil plotted above has a thickness-to-chord ratio of 12%. This means that the height at the thickest section is equal to 12% of the total chord. Defining the thickness in terms of a percentage allows an airfoil design to be independent of the chord such that a single airfoil profile (shape) can be specified for any wing of a given chord length.
The final design parameter we'll discuss is camber which is a measure of the asymmetry between the upper and lower surface. Camber is generally introduced to an airfoil to increase its maximum lift coefficient, which in turn decreases the stall speed of the aircraft. The camber line is a line drawn equidistant between the upper and lower surface at all points along the chord. Highly cambered airfoils produce more lift than lesser cambered airfoils, and an airfoil that has no camber is symmetrical upper and lower surface.
Airfoil Tools
Once you are comfortable with the definitions given above you should be able to describe an airfoil design in terms of thickness and camber. You may now be wondering how engineers go about designing or specifying an airfoil. NASA/NACA, among others, has completed a LOT of work designing, parameterizing and creating a library of airfoil sections that are often used (or used as a starting point) when designing a new aircraft. Thankfully, there are a number of references on the internet where you can go and download the coordinate geometry for just about any airfoil you may want to view or use.
AeroToolbox has a two great calculators where you can specify and download the coordinates of any NACA 4 or NACA 5 series airfoil:
If that doesn't give you what you need you can also check out the UIUC Airfoil Coordinate Database or airfoiltools.com.
A Practical Design Example
Let’s take our new-found airfoil knowledge and apply it to a small study that nicely illustrates how different airfoil profiles are used on different aircraft to help fulfill that aircraft’s intended mission. We’ll introduce the three aircraft in our study, characterise the properties of the airfoils selected, and then compare them directly, by examining each airfoils’ lift and drag properties.
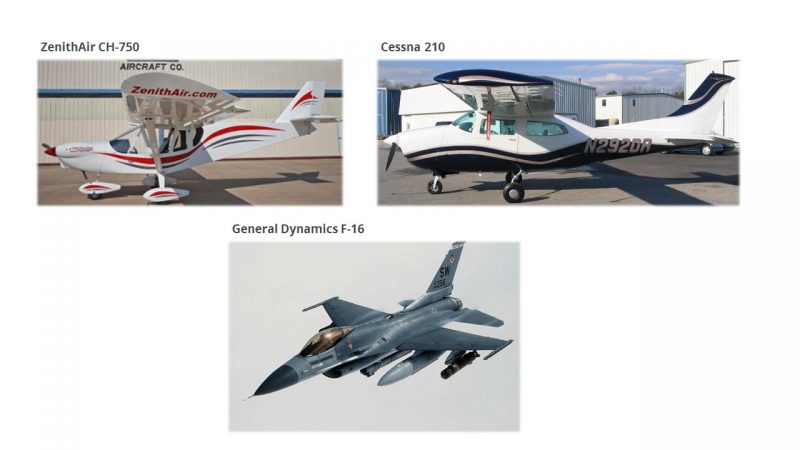
The three aircraft in our study are the Zenith Aircraft Co. CH-750, the Cessna 210 Centurion, and the General Dynamics F-16 Fighting Falcon.
Zenith Aircraft Co. CH-750
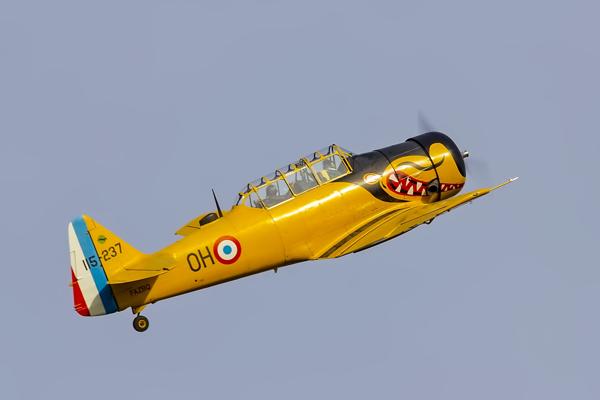
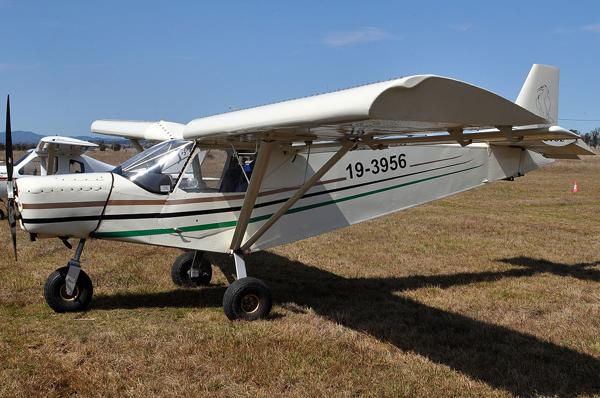
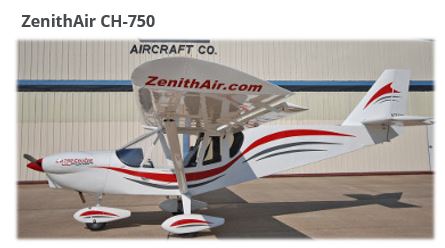
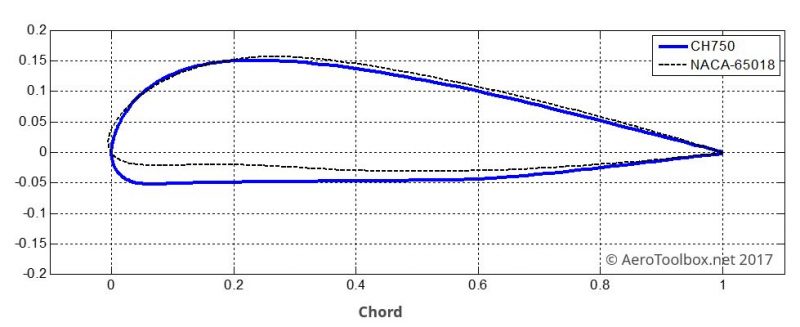
The first aircraft we’ll consider is the Zenith CH-750. This small two-seat aircraft is designed as an “off-airport” short takeoff and landing kit aircraft to be flown as a Light Sport Aircraft. While its cruise speed (max: 100 mph) may not get you to your destination particularly quickly, the aircraft is designed to get you off the ground as quickly as possible. The CH-750 boasts a takeoff role of a mere 100 ft (30m) at sea level thanks in part to its large wing (read all about the importance of wing area here) but also as a result of the thick wing section chosen for the aircraft.
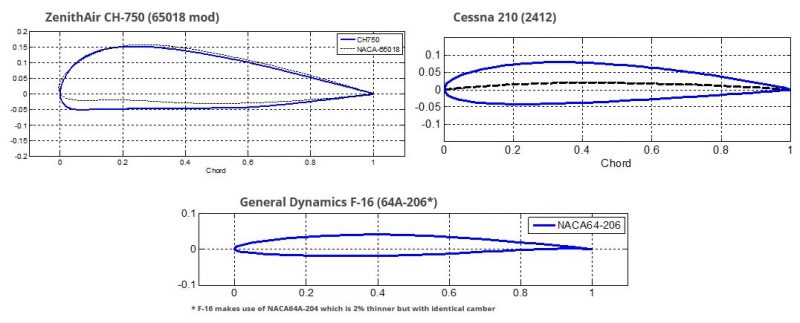
Zenith make use of a modified wing profile that is based on a NACA 65018 with modifications to smooth the lower surface. It has a thickness-to-chord ratio of 18% and a design lift coefficient of 0.9. The wing is highly cambered in order to produce such a high design lift coefficient. This is a wing intended to produce a lot of lift at low speed which allows the aircraft to get airborne very quickly. That ability to get airborne quickly comes at a price though – the high camber and thick airfoil produces a lot of drag which reduces the aircraft’s cruise speed. This is rather intuitive: a thicker wing will create a greater impediment to the flow of air past it, which in turn creates more drag. The NACA 65018 profile is shown by the dotted black line in the figure below with the approximate CH750 profile in blue. The lift and drag properties of this airfoil is studied in more detail below when we compare all three example airfoils together.
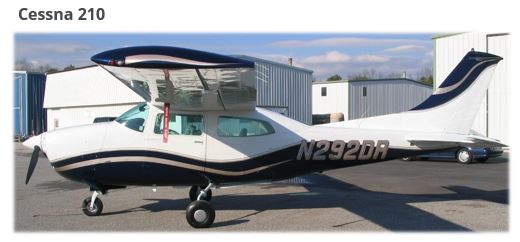
Cessna 210 Centurion
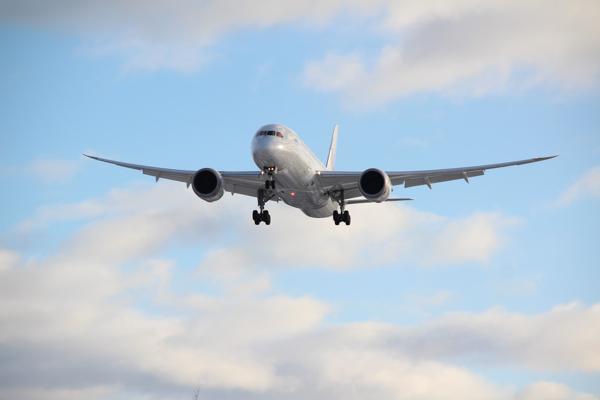
The Cessna 210 may have a high wing and single engine like the CH-750, but that is as far as the similarities go. This is a six-seat general aviation aircraft with a 310 HP turbocharged engine which enables it to cruise around 190 knots (350 km/h or 220 mph). The takeoff distance is approximately 1400 ft (430 m) at sea level. Almost 10 000 were produced between 1957 and 1986 and in many ways the C210 still sets the benchmark for a fast, reliable 6 place touring aircraft.
If you compare the C210 to the CH-750 you should immediately pick up that the Cessna airfoil is considerably thinner than that of the CH-750. The C210 makes use of a NACA 2412 airfoil at the root (later models used a NACA 64A-415) which is a fairly conventional airfoil profile with a maximum camber of 2% of the chord located at 40% of the chord.
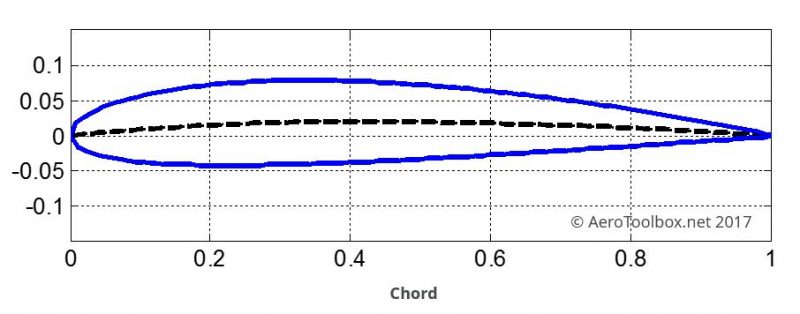
Comparing this airfoil to the modified NACA 65018 of the CH-705 reveals a profile that produces less drag as it's thinner and more streamlined. The airfoil is also less cambered than the NACA 65018 which means it produces less lift for a given angle of attack when compared to the CH-750 airfoil. This results in a longer takeoff run as the aircraft needs to be at a higher speed to produce sufficient lift to get airborne.
General Dynamics F-16 Fighting Falcon
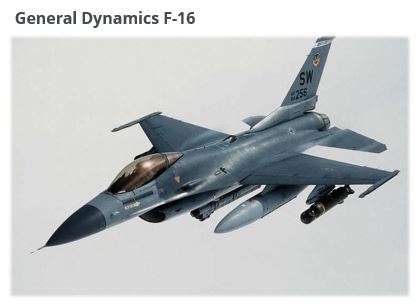
The third aircraft that we’ll use to round off our airfoil comparison is the General Dynamics F-16 Fighting Falcon. This fourth-generation fighter first flew in 1974 and is in active service with the United States Air Force as well as twenty-five other operators. Over 4500 F-16's have been delivered making it one of the most successful military aircraft ever produced. With a top speed at sea level of Mach 1.20 and the ability to reach Mach 2.0 at altitude, this fighter will continue to see active service in a number of air forces for many years to come. The F-16 uses a modified NACA 64A204 airfoil similar to the NACA 64A206 pictured below.
Notice how thin the airfoil looks in relation to the CH-750 and C210 pictured above. This is an airfoil designed for supersonic speeds and as a result needs to be shaped almost like a diamond in order to keep shockwaves from forming at high speed. The supersonic aerodynamics at play here is too in depth for this discussion; suffice to say that this thin airfoil is built for speed and not to produce large amounts of lift at low speed.
Let’s look at all three airfoils next to one another before diving into the airfoil engineering principles used to select each one for the aircraft considered.
Putting it all Together
A few fundamental aerospace concepts must be understood before diving into the more technical discussion as to why the aircraft manufacturer selected the airfoil profiles they did for the three aircraft that form our study. Click on the links below to brush up on the following concepts:
So to summarize the concepts above:
Lift and drag coefficients are a dimensionless normalization of the amount of lift or drag being produced.
The aerodynamic coefficients are normalized by wing area and dynamic pressure.
Dynamic pressure is defined as the kinetic energy per unit volume of a fluid particle and is a function of air density and velocity.
The lift coefficient of an airfoil is increased by increasing the angle of attack up to the stall angle.
The slower and aircraft flies, the higher the lift coefficient required to keep the aircraft in the air. Slower flying speeds result in a lower dynamic pressure and therefore a higher lift coefficient is required in order to produce sufficient lift equal to the aircraft weight. The maximum lift coefficient is produced just before the aircraft stalls; after which any increase in the angle of attack will reduced the lift produced and decrease drag.
In subsonic flight, the total drag produced by a wing is made up of two components namely profile drag (due to the wing obstructing the airflow) and induced drag (drag induced as a by-product of the lift produced by the wing). Therefore the greater the lift coefficient at which the aircraft is flying, the greater the drag force produced by the wing. You can brush up on this here.
XFoil is a very handy airfoil design tool (available as a free download) which I have used to generate the lift and drag plots of the three airfoils considered in this study. A few important assumptions must be stated when using this tool:
- The wing (airfoil section) is assumed to be infinitely long and as such the induced drag component as a result of vortex roll-up at the wingtips is neglected.
- The values produced by xFoil are for the airfoil section only and do not take into account the rest of the aircraft components. As a result, the lift-to-drag ratios produced by the tool are much greater than the actual aircraft would produce in reality.
Notwithstanding, the tool provides a great insight into the choice of airfoil made by each aircraft manufacturer. If you are looking for a more in depth mathematical model to estimate the total drag of an aircraft you can read Part 9 of this series.
Let’s first look at how the lift coefficient produced by each airfoil varies with the airfoil angle of attack. Here the angle of attack is simply defined as the angle that the airfoil chord makes with the direction of the airstream. As you would expect, increasing the angle of attack on each airfoil section results in an increase in the lift coefficient, which is synonymous with an increase in the total lift produced at a given aircraft speed (dynamic pressure).
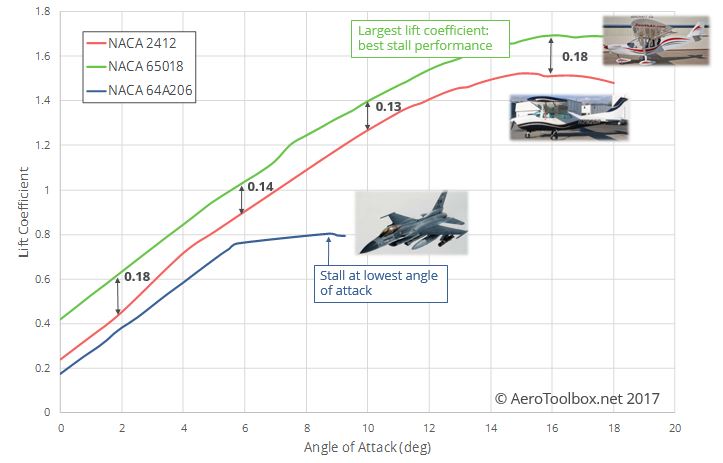
Each airfoil produces a differing lift coefficient for a given angle of attack. The Zenithair CH-750 airfoil has both the highest maximum lift coefficient (approximately 1.70) as well as the largest lift coefficient at an angle of attack of zero degrees (0.40). This is as a result of the high camber and large thickness-to-chord ratio employed on this airfoil.
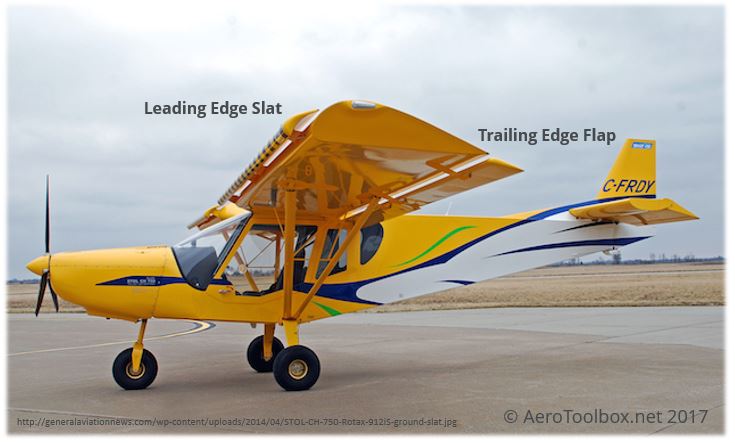
You will remember that the CH-750 is able to get airborne in only 100 ft (30 m). Selecting an airfoil with a high maximum lift coefficient means that the speed at which the wing is able to produce sufficient lift to get the aircraft airborne is lower, resulting in a very short takeoff roll. While the nominal airfoil produces a lift coefficient equal to approximately 1.70, the aircraft is fitted with a leading edge slat as well as a full-span, fixed, trailing edge flap which serves to increase the effective camber of the airfoil section and increase the maximum lift coefficient further. In fact the manufacturers specification sheet states that the stall speed is 35 mph (56 km/hr or 15.56 m/s). We can use this information to determine the maximum lift coefficient that the airfoil + slat + flap combination produces.
As shown in the calculation below, the maximum lift coefficient of the CH-750 is approximately 2.95 at sea level!
Let’s now compare the lift curve of the Cessna 210 airfoil to that of the CH-750. You should notice that both lift curves are of a similar slope; albeit that the lift coefficient of the NACA 2412 (C210) is offset by an average of 0.16 below the CH-750 airfoil. This can be interpreted in a number of ways: (here it’s assumed that wing area, velocity and atmospheric conditions are equal for both wings).
- The NACA 2412 will produce less lift at a given angle of attack.
- The stall speed of the NACA 2412 wing will be greater than that of an identical wing with NACA 65018 profile by the ratio of the maximum lift coefficient of each wing.
- The change in lift coefficient with changing angle of attack (lift slope) is approximately similar for the two airfoils.
The lifting properties of the F-16 wing are poor relative to the other two aircraft. This would result in poor low speed flying characteristics (high stall speed and long takeoff roll) if this wing profile was used on either the C210 or CH-750. However this is not a problem for the F-16 as it is designed to operate at high speed and its powerful jet engine allows it to accelerate quickly to the required takeoff speed during departure.
Looking at the lifting properties of the wing profile only tells part of the story. A more highly cambered, thicker wing may produce more lift than a thin symmetrical airfoil but without looking at the resulting drag produced by each, your understanding of the various merits of each profile is incomplete.
It is important to understand that the additional lift generated by a thicker and more cambered profile comes at a cost: additional drag. A convenient way to measure the efficiency of an airfoil is too look at the ratio of the lift to drag it produces. This aerodynamic efficiency gives a measure of how efficiently the airfoil is able to generate lift. It makes sense to design your aircraft to cruise at or around the position where the lift-to-drag ratio is at a maximum. The faster the aircraft cruise speed, the lower the cruise lift coefficient (recall that the amount of lift produced is a function of airspeed squared), and so an airfoil profile should be selected that maximizes the aerodynamic efficiency for the design cruise CL.
It’s important to note when looking at the graphs below that the actual aircraft efficiency ratio will be much lower than what is shown here. These plots are only looking at the 2D airfoil characteristics and do not include sources of drag such as the 3D wing, fuselage, tailplane etc. The values below are just for illustration and should be understood as such.
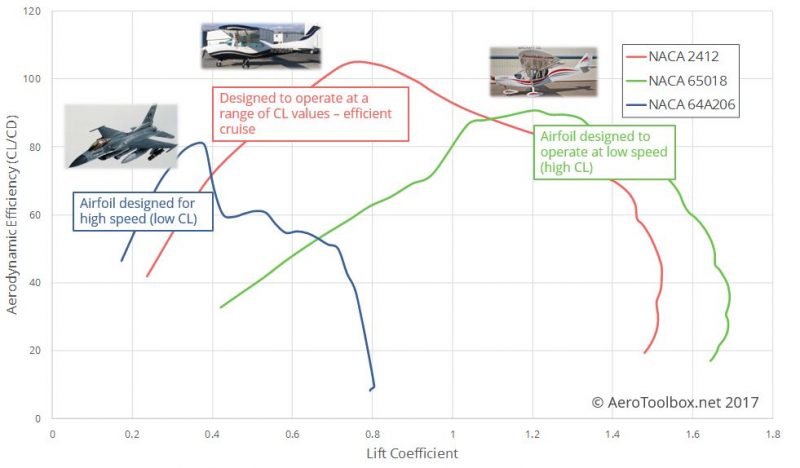
The CH-750 is most efficient at a high lift coefficient which underlines its slow speed characteristics. The Cessna 210 is designed to be an efficient touring aircraft and so you can see by looking at the graph that the thinner airfoil is in fact more efficient than the CH-750 all the way up to a lift coefficient of 1.0. The Cessna focuses on an efficient cruise at the expense of short field performance. Put another way, the CH-750's ability to takeoff and land from a very short runway comes at a cost - the thick wing produces lots of lift at low speed but hurts the aircraft in the cruise with an inefficient wing at all but low speeds (high CL). This phenomenon is exaggerated even further by the installation of fixed flaps and a slat on the CH-750 which further increases the lift coefficient of the airfoil with a corresponding large drag penalty (not shown here).
The F-16 has the lowest aerodynamic efficiency of the three aircraft studied here - however it should be remembered that the F-16 is designed to operate at transonic and supersonic speeds where wave drag becomes a significant drag component (not shown here) and as such the wing is designed to reduce the drag at these very high speeds. What the graph does show though is that the F-16 is most efficient at high speeds where the lift coefficient is low (high speeds).
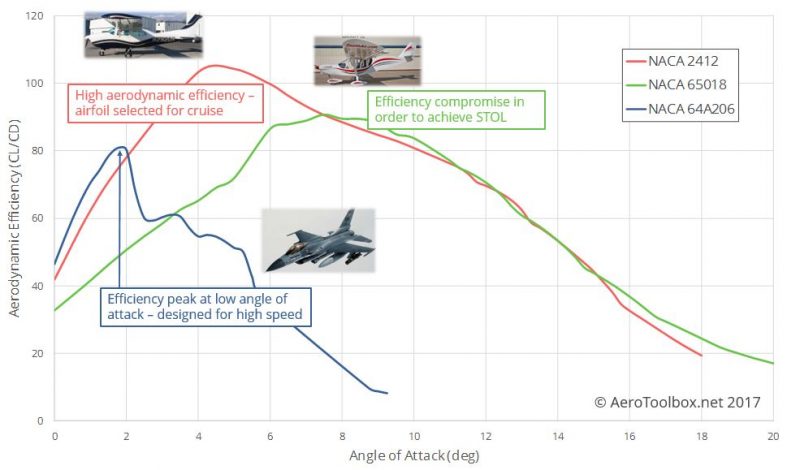
A final way to reinforce what has been shown is to plot the aerodynamic efficiency against angle of attack: The slow speed CH-750 is most efficient at high angles of attack (slow speeds), the C210 is able to operate efficiently through a large range of cruise speeds and angles of attack, and the F-16 is most efficient at low angles of attack and high speeds.
Thanks for reading this introduction to airfoil design and selection. In reality, the selection of an airfoil is an iterative process that accompanies a detailed performance estimate of the aircraft.