Introduction
This is the third post in a series of fundamental aircraft design articles which aim to give you an introduction to aircraft design principles. In the previous post we examined the lift, drag, and pitching moment coefficient acting on an aerodynamic body caused by the resulting pressure and shear distribution. In this post we discuss the importance of wing design, specifically wing area and aspect ratio, and show why it is a great place to start when designing a new airplane. An aircraft’s wing is the primary contributor to it's ability to generate a lifting force greater than its weight, and therefore take flight. If you’ve spent any time looking at pictures of airplanes or taken a walk around an airport (highly recommended) you may have noticed that there is an enormous variation in the size and shape of the wings attached to each aircraft. Every wing is carefully sized to best fulfill the mission specifically intended for that particular airplane.
An aircraft’s wing is the primary contributor to it's ability to generate a lifting force greater than its weight, and therefore take flight. If you’ve spent any time looking at pictures of airplanes or taken a walk around an airport you may have noticed that there is an enormous variation in the size and shape of the wings attached to each aircraft. Every wing is carefully sized to best fulfill the mission specifically intended for that particular airplane.
In this post we delve a little deeper into two critical geometric characteristics that determine how a wing functions, namely: Wing Area and Aspect Ratio and introduce a third component: Sweep Angle (sweep post here).
Wing Design Parameters
Take a look at the collage of airplanes shown below. Each is a very different size and shape, and designed to fulfill a very different mission. Each has a unique wing which is shaped differently to the others. Take a moment to look over each one and see if you can spot and describe how they differ geometrically.
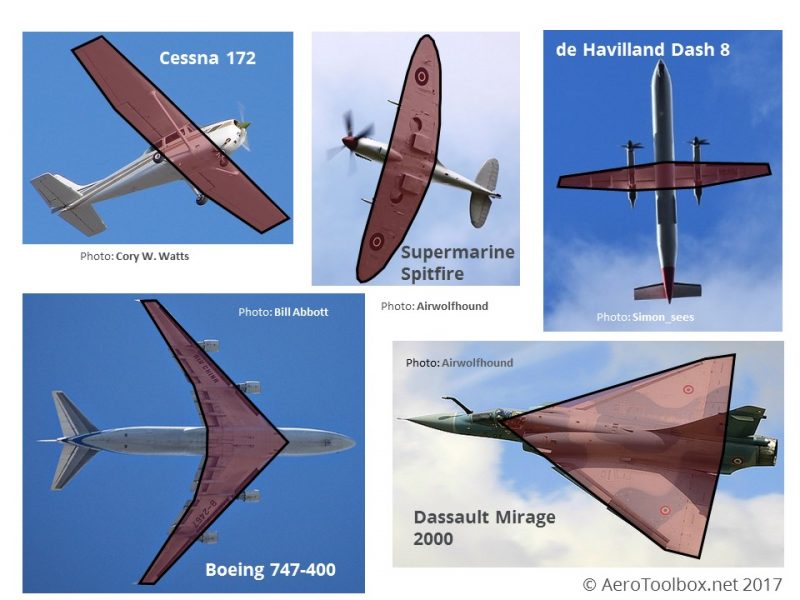
Let's start with the venerable Cessna 172 pictured on the top left. This is a basic trainer with docile handling characteristics, a pedestrian cruise speed and is relatively easy to land as a result of it's low stall speed (43 knots in landing configuration). The wing is straight, almost rectangular and sits above the fuselage.
Next up is the Supermarine Spitfire. This iconic World War II era fighter is famous for the role it played in the eventual defeat of the Nazi regime. Highly aerobatic it has achieved cult status in part due to it's distinctive elliptical wing.
The de Havilland Dash 8 Q400 is an 80 seat regional airliner with two large turboprop engines. It is designed with a long thin wing which helps it reach a cruising speed of 350 knots.
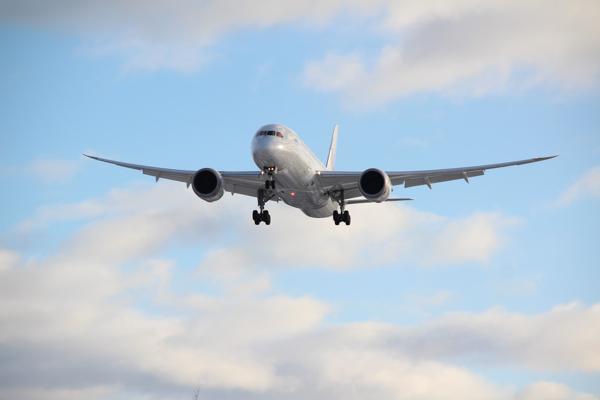
The Boeing 747-400 needs no introduction; it has been ferrying passengers on long transcontinental trips in various configurations since 1970. The B747 wing has a triangular leading edge, a large wingspan, and tapers progressively in chord as one moves towards the wingtip.
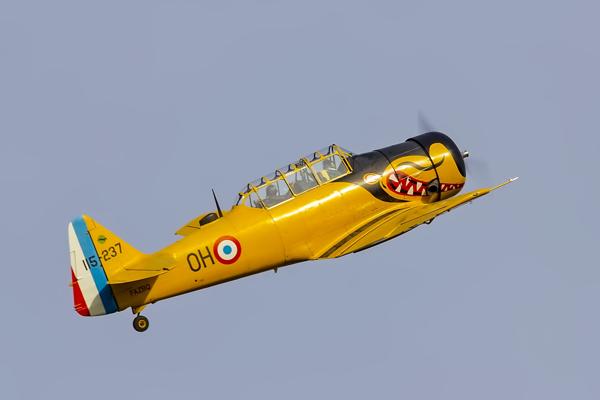
The final aircraft in our study is the Dassault Mirage 2000. This is a single-engined, fourth generation fighter capable of speeds greater than twice the speed of sound (Mach 2.2). The wing is triangular or delta shaped.
Let’s now get a little more scientific in the terminology we use to describe each wing.
Wing Area
Wing Area and Aspect Ratio are primary considerations when designing a subsonic aircraft (everything from a C172 to the Dash 8 Q400 shown above). Sweeping the wings becomes important once the aircraft begins to approach transonic and supersonic speeds (B747 and Mirage 2000).
Wing area is a fundamental geometric characteristic and is simply taken as the plan surface area of the wing
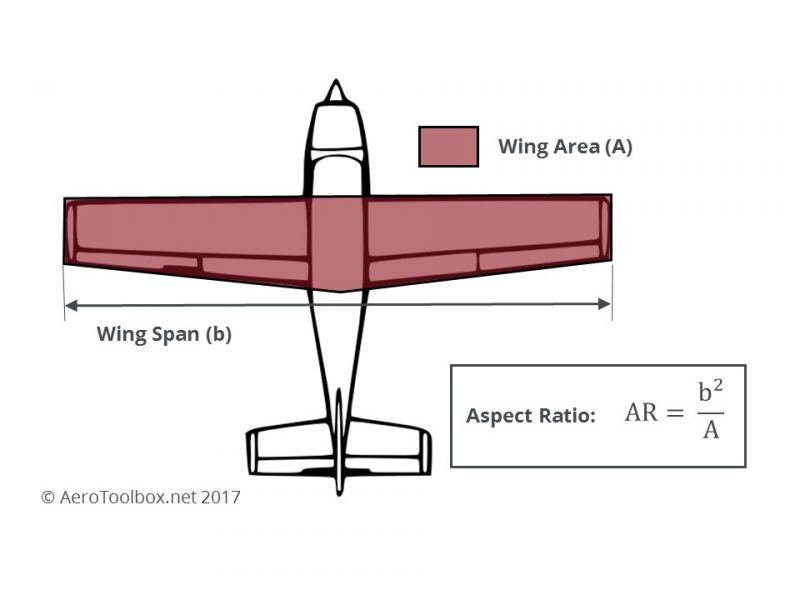
Note that the fuselage section through which the wing is installed is included in the wing area calculation.
Aspect Ratio
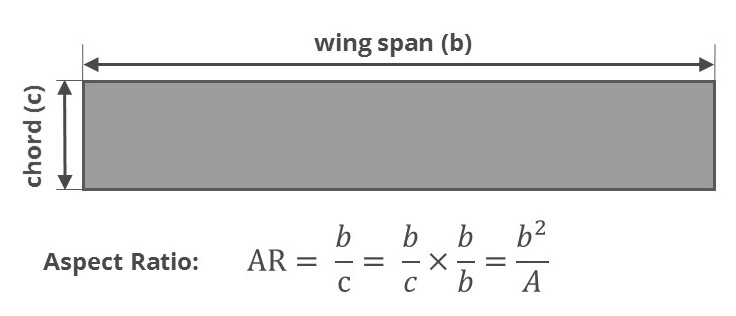
Aspect ratio is the ratio of the span of the wing to its chord.
Low aspect ratio wings will be short and fat, while high aspect ratio wings are long and thin. Most aircraft wings are not perfectly rectangular and so a little manipulation is required to formulate a convenient equation to calculate the aspect ratio quickly and easily. The aspect ratio is then simply calculated as the wing span squared, divided by the wing area.
Sweep Angle
The final wing parameter we will introduce now is the wing characteristic sweep angle.
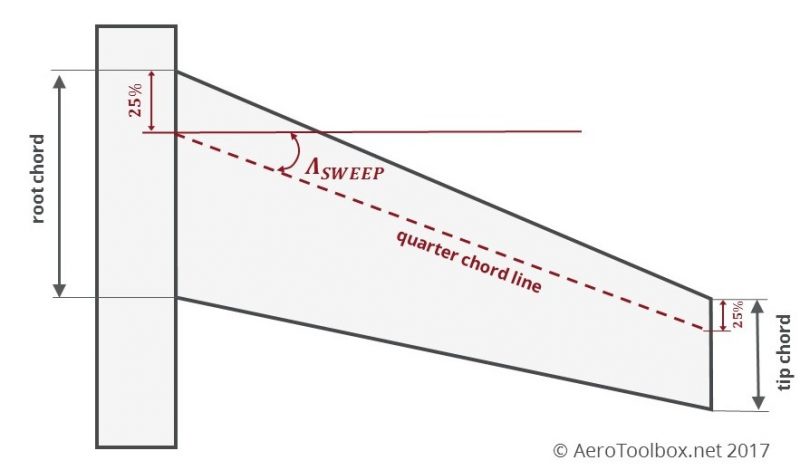
The sweep angle of a wing is the angle at which the wing is translated backwards (or occasionally forwards) relative to the root chord of the wing.
The sweep angle most commonly quoted by aircraft designers is the quarter chord sweep angle and is calculated by finding the angle between the wing root and wing tip quarter chord (25 % of the respective chord measured from the leading edge). It’s easiest to describe how to determine the sweep angle it by means of a diagram.
The sweep angle is dealt with in greater detail in the post which follows this.
Now that you are familiar with the concepts of wing area, aspect ratio and sweep angle, lets put this new found knowledge together and examine how these variables affect the overall performance of the wing and aircraft.
Wing Design Parametric Analysis
Below is a table with some mass and wing parameters for a wide range of aircraft starting with the Cessna 172 and ending with the Airbus A380-800. In the table is the maximum takeoff weight, wing area, aspect ratio and typical cruise velocity. You’ll also notice an additional column labelled wing loading which is simply the maximum weight of the aircraft divided by the wing area. We’ll look at wing loading in more detail further into the post but for the moment you can think of it as a measure the lift density of the wing or how hard the available wing area must work to keep the aircraft in the air.
Wing Area and Takeoff Weight
You know from reading the post on fundamental forces acting on an aircraft that the wing is responsible for creating the lifting force that is designed to counteract the weight of the aircraft. Therefore it logically follows that the heavier the aircraft, the larger the wing that is required to keep it in the sky.
In fact there exists a clear linear relationship between the design wing area and the maximum takeoff weight all the way from the Cessna 172 to the Airbus 380-800.
This is a really useful result for anyone trying to design a wing for a new airplane as it provides a convenient starting point when sizing a wing. If you have an approximation to the Maximum Takeoff Weight, you can estimate the approximate wing area required!
Of course sizing a wing in this manner is very crude and should only be used as a starting point in your wing design. You will need to take into account the mission (set of requirements) the aircraft is designed around and build your wing with a view to accomplish this mission. One very common design requirement usually specified early on in a design is the intended aircraft cruise speed. Let’s examine how this affects the preliminary wing design.
Wing Loading and Cruise Speed
It is quite intuitive that the larger the wing the more drag it produces as there is a greater impediment to the flow of air around the aircraft. We also now know that the heavier the aircraft, the larger the wing required to support the weight in flight. Therefore if we want to look just at the effect of cruise speed on the wing area we need a way of normalizing each aircraft so we can compare them directly without worrying about the effect of the weight of the aircraft on the size of the wing. This is accomplished by dividing the weight of the aircraft by the wing area to produce a factor known as Wing Loading. This gives an indication of the lift density of the wing; how much lift must be produced by each unit area of the wing in order for the aircraft to remain airborne. The aircraft decreases in weight as it flies (the result of burning fuel) and the payload also differs every flight. It's convenient then to use the maximum takeoff weight when calculating wing loading as this is a constant value for each aircraft.
Below is plot of the variation of wing loading (x-axis) with cruise speed (y-axis).
It is clear that aircraft with higher cruise speeds require a more highly loaded wing.
This makes sense when you think about it: in order to cruise efficiently at a high speed you want as small a wing as possible to keep the cruise drag to a minimum. In fact we will show in a later post that drag is actually a function of the square of the airspeed. Aircraft of different sizes but with similar cruise speeds will generally be designed with a similar wing loading. An aircraft with the same cruise speed as a competitor but designed with a lower wing loading (larger wing) would generally require more thrust at cruise to overcome the additional drag of a larger wing. This will in turn will result in the aircraft burning more fuel than its competitor over an identical flight leg which would result in it being deemed inefficient or uneconomical to operate relative to its peers.
Let’s compare the wing loading of a few of the aircraft in our list:
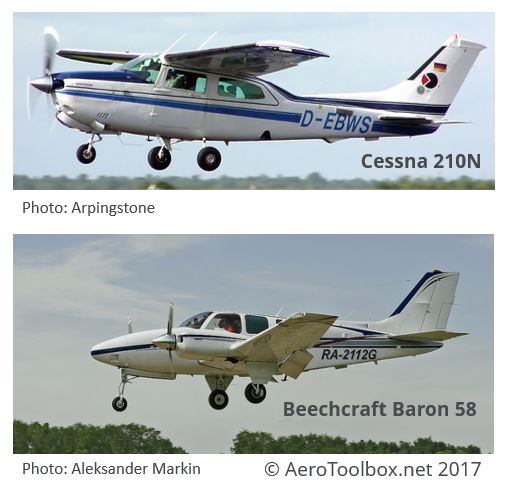
The Beech Baron and the Cessna 210 are both six place high performance general aviation aircraft. The Cessna 210 has a single piston engine while the Beech Baron is a twin. They have an almost identical wing loading but the twin-engine configuration of the Baron means that it is slightly heavier, and as a result has a slightly larger wing in order to carry that extra weight.
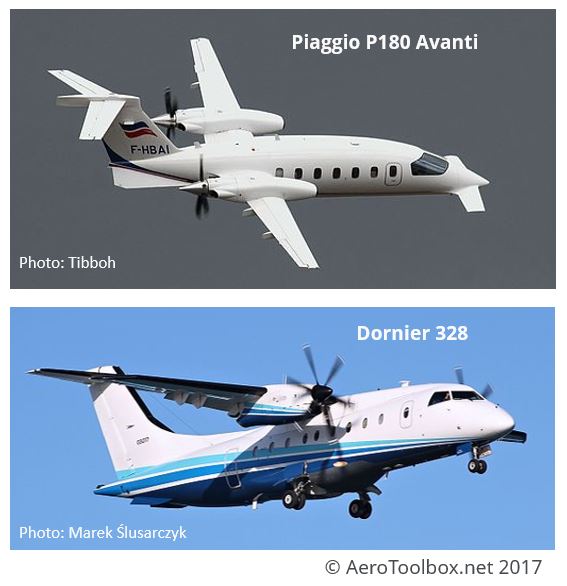
Two very different looking aircraft, the Italian Piaggio Avanti II and the Dornier 328 are not that different when comparing their wing loading and cruise speeds. The Avanti is a 9 place executive turboprop with supercar lines and a slippery 395 knot cruise speed (TAS) while the 32 seat Dornier 328 Regional Airliner weights 2.7 times that of the Avanti at MTOW and cruises at 335 knots (TAS). The Do328’s wing is 2.5 times larger than the Avanti which gives them a very similar wing loading (67.06 lbs/ft² Avanti and 71.63 lbs/ft² Do328).
The Boeing 767-300 and the Airbus A330-300 are a great example of how closely cruise speed defines the required wing area. Both aircraft are designed to cruise at 470 knots. The A330-300 is designed to carry more passengers than the B767-300 and as a result has a Maximum Takeoff Weight 28% larger than the Boeing. The wing of the A330-300 is larger also - by 28%, a perfect correlation!
The few examples given above illustrate just how useful a parameter wing loading can be; especially when just starting out on a new aircraft design.
Aspect Ratio and Cruise Speed
Now that we’ve covered wing area let’s move onto a second important parameter: Aspect Ratio.
Aspect ratio is a measure of the ratio between the span of the wing to its chord. In most cases the wing chord is not equal along the length of the span (untapered) which is why aspect ratio is most commonly calculated by dividing the square of the wing span by the reference wing area. You can refer to the image earlier in this post where the formulation of the equation to calculate Aspect Ratio is shown.
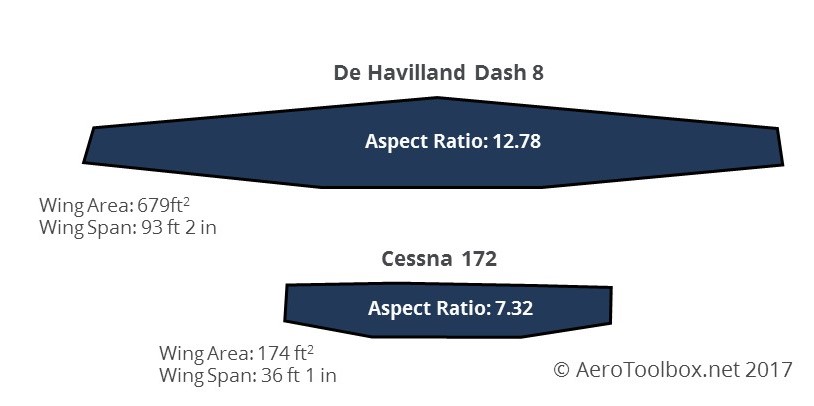
Let’s consider the de Havilland Dash 8 Q400 and the Cessna 172. Both wings are fairly conventional with some taper and little or no sweep. This provides a clear example of the effect that aspect ratio has on the appearance of the wing. The Cessna 172 wing has an aspect ratio of 7.32 while the Dash 8 has a much higher aspect ratio of 12.78.
Why would these two aircraft be designed with such a large variation in aspect ratio? The first clue is to look at their respective design cruise speeds. The Cessna has a cruise speed of 122 knots true (KTAS) while the Dash 8 is significantly faster at 360 KTAS.
To explain why a higher aspect ratio is necessary to fly at higher speeds we need to introduce the fundamental drag equation for a wing. We go into a lot more detail regarding wing drag where it is covered in it’s own post but for now we’ll just introduce the drag formula and give a quick introduction to its various components.
Wing Drag Components
Wing drag can be broadly broken down into two components: zero-lift drag and lift induced drag.
Zero-lift drag (often also called parasitic drag) is the drag that exists as a consequence of moving a body through a medium. In the case of an aircraft, that medium is air. This is analogous to the resistance you feel on your body when swimming, although the density of water is 1000 times that of air. The much greater density makes it easier to visualize this phenomenon in water than in air. Parasitic drag is in turn made up of a number of different components like form drag, friction drag and interference drag but this is outside of the scope of the discussion here (this is all discussed in Part 9 of this series). The name given to these components is zero-lift drag as this drag force is developed as a consequence of the shape of the aircraft and not as a consequence of the generation of lift.
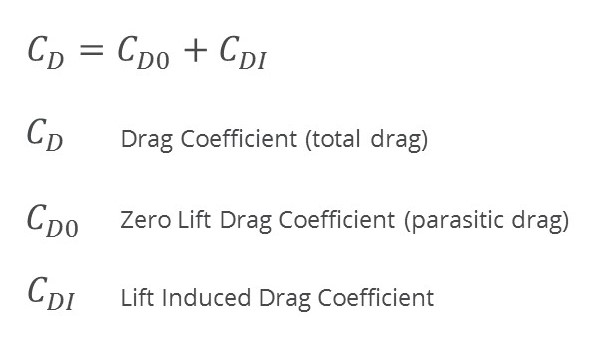
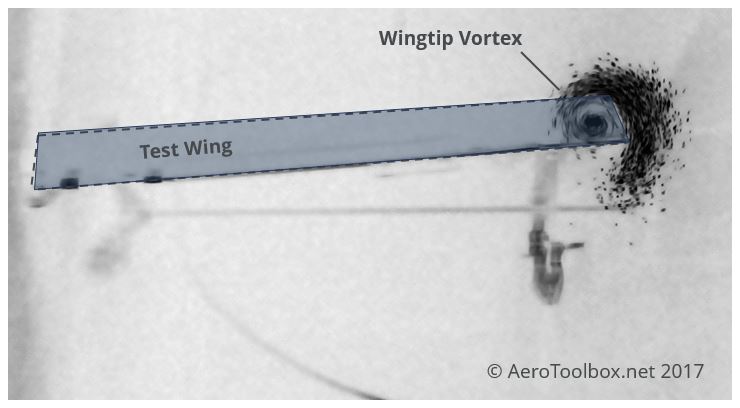
The second major drag component is the lift-induced drag component. This is the drag force produced as a consequence of the generation of lift. Broadly a wing creates a lifting force as a result of the pressure difference that exists between the upper and lower surface of the wing. The curvature on the wing upper surface induces a pressure drop relative to the lower surface which sets up a pressure gradient between the two. Air will always move from a relative high pressure to a low pressure region (this is why we experience wind as local pressure differences exist over a geographical region). This pressure difference between the two wing surfaces results in the creation of the upward force we refer to as lift. At the tip of the wing there still exists a pressure difference between the two surfaces, however there is now nothing to impede the movement of air from the lower surface to the upper. This causes the air on the lower surface to roll up and over the upper surface and form a wingtip vortex on the tip of each wing which propagates through the atmosphere producing a lift-induced resistance (drag force) to the movement of the aircraft through the atmosphere.
This wingtip vortex is nicely captured by a photograph I took while completing my MSc. The photo was taken from the back of a wind tunnel where neutrally buoyant helium bubbles passed over the wingtip and were captured in a plane of light to show the vortex cross-section.
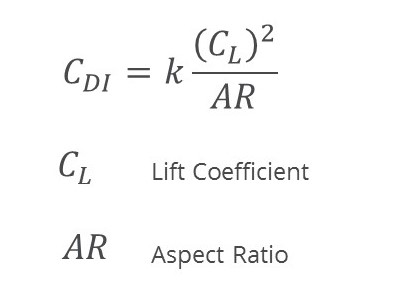
The total lift-induced drag force is a function of the square of lift coefficient of the wing; hence the term lift-induced. The lift coefficient can be thought of as a non-dimensional term that provides an indication as to how hard the wing has to work to produce the required lift. The lift coefficient is increased by increasing the angle of attack of the wing or changing the wing curvature by deploying flaps like you see during landing.
You will also notice that the magnitude of the lift-induced drag is inversely proportional to the aspect ratio. Therefore as the aspect ratio increases, so the lift induced drag decreases.
Aspect Ratio and Weight
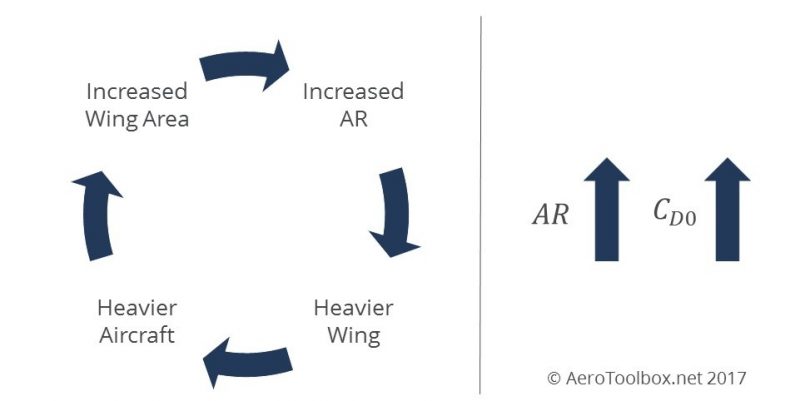
Based on the above equation you would assume then that the answer to minimising drag would simply lie in creating a wing with the largest possible aspect ratio. However this is unfortunately not the case as with all things in life there are trade-offs that must be considered. The first is that the higher the aspect ratio, the greater the wing span for a constant wing area. The wing is responsible for generating the lift force that keeps the aircraft in the air and a higher aspect ratio results in a heavier wing as the structure must be beefed up to carry the additional bending moment that the longer span induces. A heavier wing results in a heavier aircraft which means that either the payload must be reduced or the maximum takeoff weight increased, which results in a larger wing and the need for additional wing area. This is best illustrated by a closed loop diagram that shows the conundrum that an aeronautical engineer faces when designing a new wing. But that's not all; there is another aspect that must also be examined: a higher aspect ratio wing results in an increase in the zero-lift drag as there is a larger wing wetted area exposed to the air.
Clearly there is a trade-off that will result in the optimum aspect ratio where the total drag (zero-lift + lift-induced) is at a minimum for the design cruise speed.
The Drag Curve
This brings us nicely to the concept of a drag curve which is a plot of the total drag that the aircraft produces as a function of speed. Here it becomes really useful to break the drag into it's two components: the zero-lift and induced drag component. You will learn how to create this fundamental graph when we look at mathematically modelling drag in Part 9.
For the moment we are just going to focus on the relationship between velocity and the drag components. As you can see, the parasite drag increases exponentially with velocity. Looking at the induced drag line, you will notice that it decreases exponentially with velocity. This is because the additional velocity over the wing means that the wing can produce the lift required to keep the aircraft airborne at a lower angle of attack, which in turn reduces the lift coefficient of the wing, hence decreasing the lift-induced drag component.
The total drag is simply the summation of the two drag components and based on the formulae will present a minimum drag at a particular speed. You can refer to this point as being at the bottom of the drag bucket. It makes sense to design your aircraft to cruise at or near the minimum drag point and varying aspect ratio is one way to do so. It is worth mentioning that at this point another trade-off exists between minimising drag at cruise and providing enough wing area to allow the aircraft to takeoff and land safely.
Now with all the knowledge you have gained we’ll present the final plot for this lesson. Here the aspect ratio of our list of aircraft is plotted against cruise speed. This is where things get a little confusing.
As you would expect from what you have learned about aspect ratio, the faster an aircraft flies, the higher the expected aspect ratio. This is true, but only up to 360 knots where the Dash 8 cruises. Suddenly as the cruise speed goes above 360 knots, the aspect ratio of the remaining aircraft decreases sharply until we arrive at a situation where the aspect ratio of the Boeing 747-400 is approximately the same as the Cessna 172.
So how do we explain this?
Transonic Effects
What you are seeing is the effect of approaching transonic cruise speeds where wing sweep is necessary to reduce the effects of compressibility and shock wave formation on the wing.
As an aircraft approaches transonic cruise speeds (speeds in excess of Mach 0.75) the curvature on the upper wing surface causes regions of locally sonic flow to be produced. Transonic drag rise and drag divergence theory is covered in the next post but here it suffices to say that at speeds above 360 KTAS, the increased drag as a result of approaching the speed of sound (wave drag) becomes the dominant contributor to the wing's overall drag signature.
Sweeping a wing backwards (while keeping wing area constant) will result in the wing-span decreasing which reduces the aspect ratio. The faster you fly, the greater the wing sweep required and the lower the resulting aspect ratio.
The Dash 8 flies just slowly enough to not need to worry about the effects of transonic drag rise, which is why it has very little sweep and a high aspect ratio wing. The Cessna 172 doesn’t make use of a high aspect ratio wing as the additional wing area (parasitic drag increase) required to support a higher aspect ratio more than cancels out the reduction of the lift-induced drag that the higher aspect ratio affords.
As you are no doubt able to appreciate, wing design is a complex undertaking where trade-offs have to be made to result in an aircraft that best fulfills the mission it is designed to undertake. Next we will look more closely at wing sweep and compressibility effects and the drag rise associated with flying at transonic and supersonic speeds. When you’re ready head over to the next post to continue your learning.
Thanks for reading and getting through this long post! If you enjoyed it, it would be great if you could share it on your favorite social network! Feel free to leave a comment below if you would like some additional explanation on one of the topics covered.